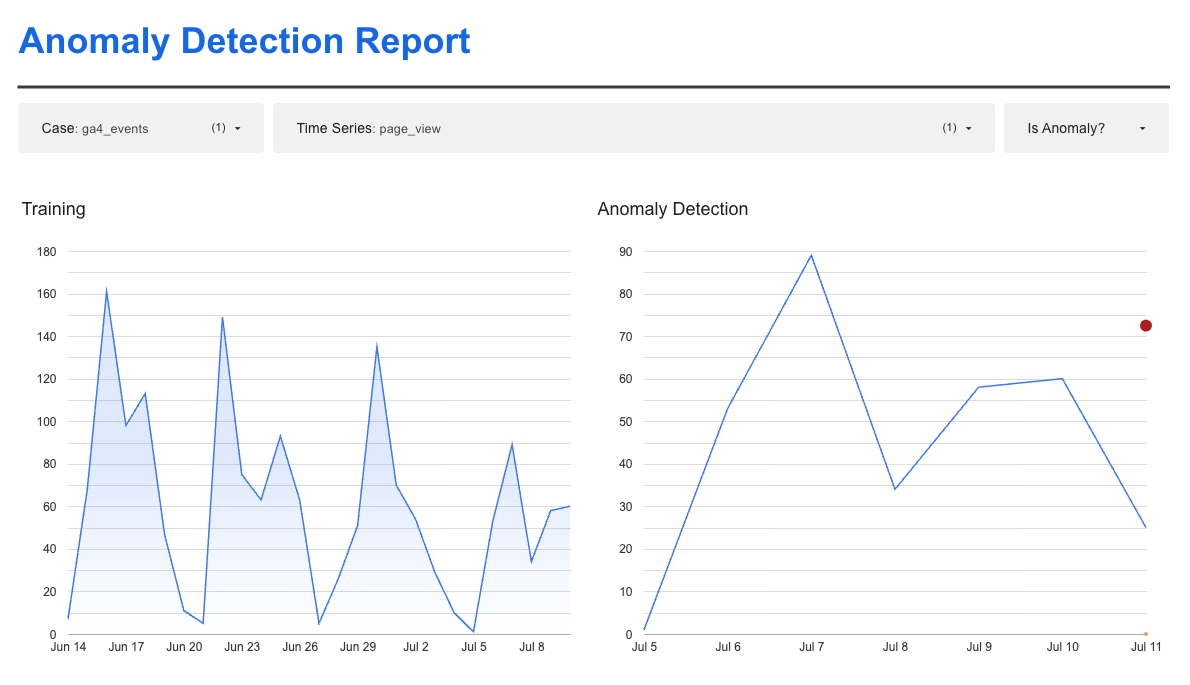
Anomaly detection is an effective way to improve the quality of your data. ARIMA_PLUS models and the ML.DETECT_ANOMALIES function are built into BigQuery, so the technical setup is straightforward. The core concepts underneath, however, are not necessarily easy to grasp, and without understanding them it is easy to get lost. Our module ships with detailed documentation, but here are the concepts I would start with.
ML.DETECT_ANOMALIES is forecasting
ML.DETECT_ANOMALIES is a forecast. It reads historical data and predicts what a value should be at a future point. Run on a daily basis, it draws on recent data to estimate what the current day should have looked like, and it flags anything outside that expected range. The work happens in two steps.
You first train a model with ARIMA_PLUS on historical data, and it learns the trend, the seasonality, and the normal variability of the series.
ML.DETECT_ANOMALIES then scores new points against that model, returning for each one an expected range (lower_bound, upper_bound), an anomaly score, and an is_anomaly flag.
One series per dimension, each with its own bounds
When configuring the model and the anomaly detection, every combination of metric and dimension becomes its own series, and the model treats each one independently, so it never compares a purchase against a page_view. Adding a new event or dimension is easy, since setting this up for a single series takes roughly the same effort as setting it up for thousands.
That granularity is what lets you watch very different time series at once. Total page views can fall 10% while a single hostname inside that total falls 90%; the aggregate shows a mild dip, the split shows a broken site. It works because each series carries its own bounds, fitted to its own history. That matters because volumes vary so much. In web analytics, a low-volume purchase can matter as much as a high-volume page_view, so no single threshold fits both, and a rule such as “flag anything that moves more than 20%” is either deafening on the small series or deaf on the large ones.
Per-series bounds are the only fair way to treat both.
Decide what not to look at
More series mean more noise.
The amount of filtering that makes sense varies from one setup to another, depending on available resources and on what the detection is meant to achieve. The GA4Dataform module includes a few filters for this: it drops series with too little history, drops series with too low an average volume, and caps each case to its top-N highest-volume series so that a long tail of rare events does not turn into thousands of noisy ones. These run before training and scoring, so they shape what the model learns in the first place.
What to leave out depends on the data itself and on the people who work with it.
An anomaly is not an alert
An anomaly is not proof that something is broken; it is a signal worth investigating.
Forecasting produces false positives fairly often, from seasonality, promotions, tracking changes, or a product suddenly going viral, so understand why the model flagged something before you treat it as a problem. The point of detection is not to raise alarms but to surface things worth a closer look.
Some of what it surfaces will turn out to be expected or harmless. The rest points to real issues in the data or the collection behind it, and those are the ones worth fixing.
What’s next
So what is worth taking from all of this? Three things.
- Anomaly detection is only as good as the data behind it, and where volumes are too low or collection too flawed, anomalies will be everywhere and none of them will mean anything.
- It is more work, not less: deploying it is a commitment to better data collection and to real time spent on what comes back.
- The process around alerting matters as much as the stack underneath it, probably more. You investigate an anomaly, you raise an alert only when it deserves one, and you spend your resources on the problems you have judged worth fixing.
GA4Dataform makes all of this easier. It does not make it automatic, and the module will not fix anything on its own. But it will save you lots of time and helps you proactively inform your stakeholders.